

$OLN Multi-bagger Checklist for a High-Quality Cyclical
Given OLN’s current trough valuation, I believe that OLN’s stock presents a very attractive risk/reward with 15-20% downside and ~3x upside.

Investing in cyclicals is very hard and calling bottoms is impossible. I usually don’t bother, unless everything lines up on my checklist:
Is the product a vital building block for the economy that is not subject to technological threats or substitution?
Is the company a low-cost producer?
Does the industry have a rational structure?
Using reasonable estimates of normalized earnings power and fundamental value, does the stock have the potential to go up multiple fold?
Is the industry at or near trough levels with signs that we are bottoming?
If the trough lasts longer than expected (which is usually the case):
Does the company generate free cash flow at trough levels?
Is the balance sheet strong enough to weather the storm?
I don’t want to try to catch a falling knife – do the technicals look good?
The purpose of this post is for informational and educational purposes only and should not be construed as a recommendation to purchase or sell any security. Do your own due diligence and seek counsel from a registered investment advisor before trading in any security mentioned. By accessing this post, you are acknowledging you have read the full disclosures which can be viewed here.
I believe OLN hits all the items on the checklist, let’s review them in order:
(1) Is the product a vital building block for the economy that is not subject to technological threats or substitution?
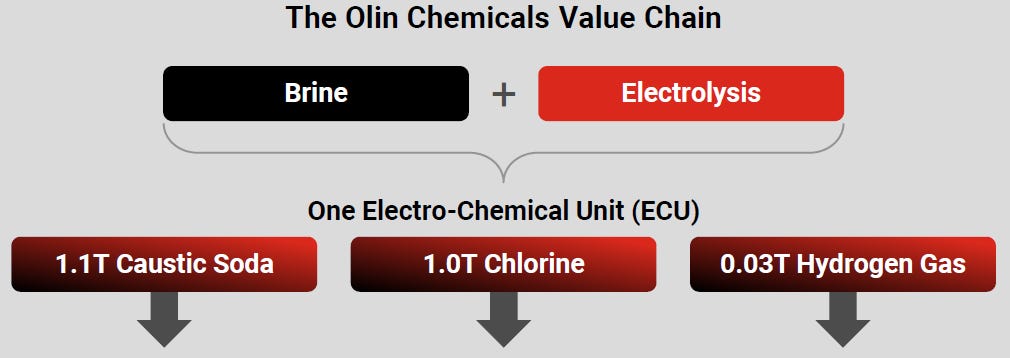
OLN’s largest segment (CAVP) makes chlor-alkali. You may not know what this is, but raw materials from chlor-alkali are contained in products you are touching and seeing right now. Chlor-alkali is produced by running electricity through brine (salt water) which produces an “ECU” which is 1.0T Chlorine, 1.1T Caustic Soda and 0.03T Hydrogen.
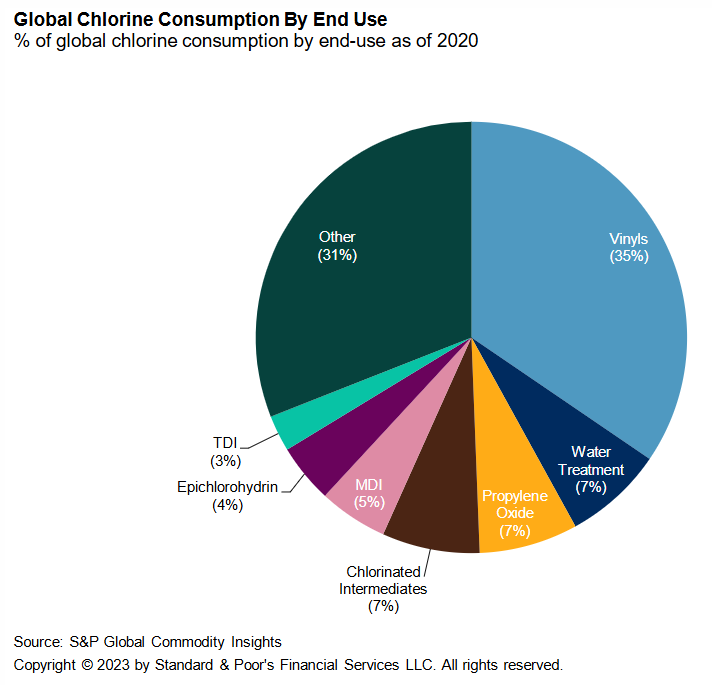
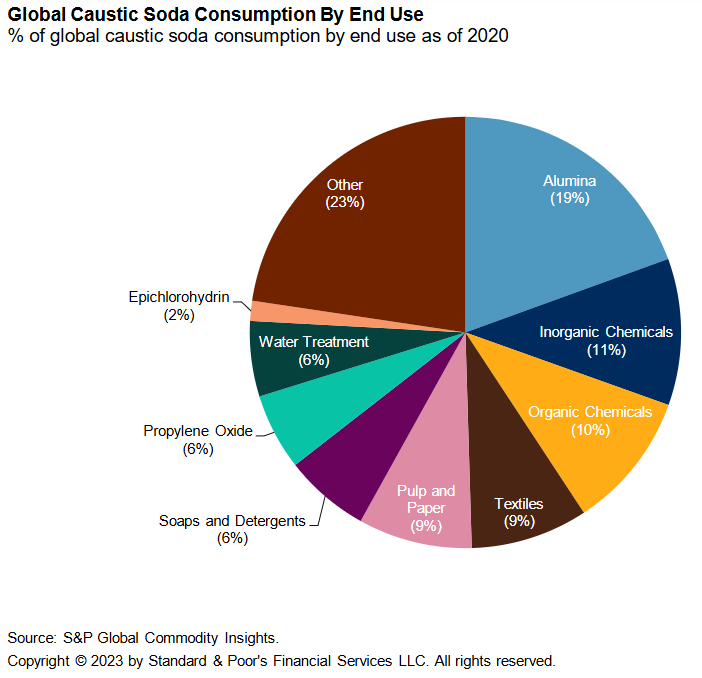
The biggest use of Chlorine (~35% of total) is for Vinyls (i.e. PVC plastic) used in everyday items such as building products, food/beverage packaging, toys, credit cards, etc. Chlorine is also used for other plastics, bleach, water treatment, and various other applications. The biggest uses for Caustic Soda are alumina, pulp/paper, textiles and various other chemicals. Like I said, you may not have heard of chlor-alkali, but it’s a vital part of your everyday life. Since CAVP is OLN’s largest segment by far, I will spend the most time discussing this business.
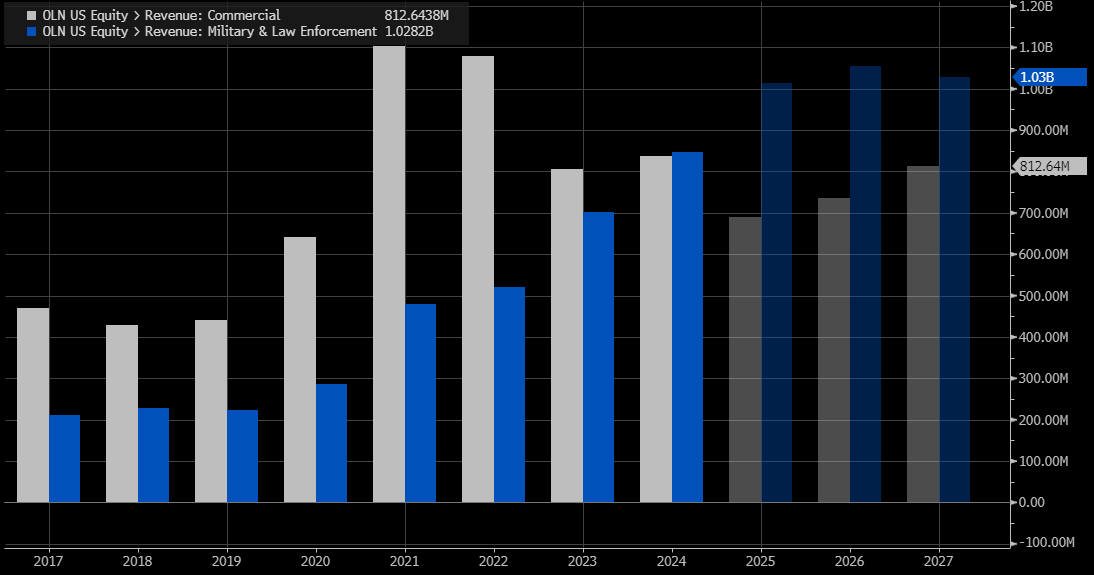
OLN’s second largest segment is Winchester, the largest maker of ammunition in the US. Winchester sells to both individuals (OLN calls these “Commercial” sales) as well as Military & Law Enforcement. Whether you are pro-gun or anti-gun, you will probably agree that Winchester (founded in 1866) is not going away. I’ll discuss Winchester more later.
OLN’s smallest, but most troubled segment is Epoxy. OLN is in this business because many of the raw materials for Epoxy are sourced from CAVP. Due to dumping of low-cost Asian epoxy into the EU and US, this segment went from being a solid EBITDA contributor to losing money on an EBITDA basis. But as I will discuss later, I believe the bleeding in this segment can be stopped, which is all I am hoping for.
(2) Is the company a low-cost producer?
The primary inputs used to make chlor-alkali are salt and electricity. The US Gulf Coast (namely LA and TX) has abundant low-cost electricity and low-cost salt from its salt domes. OLN is one of the lowest-cost chlor-alkali producers in the world because ~80% of its production is on the Gulf Coast.
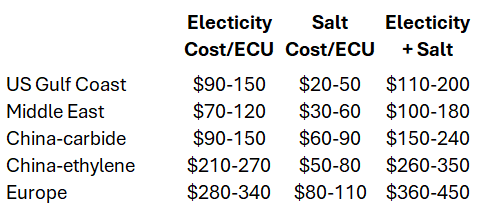
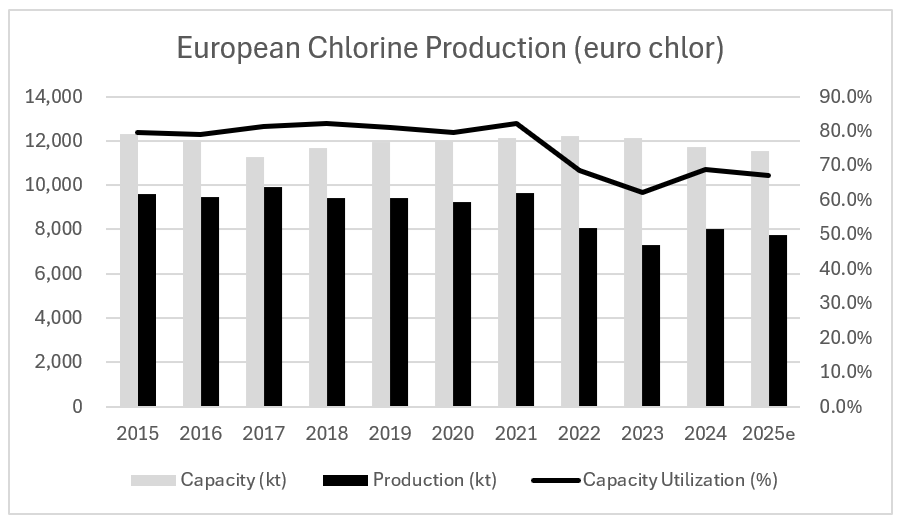
To illustrate OLN’s cost position, let’s compare Gulf Coast input costs to Europe (a high-cost region). According to euro chlor, electricity alone accounts for 68-89% of variable costs and 58-62% of total costs of producing chlor-alkali in Europe. Industrial electricity prices in the US are 50-75% lower vs the EU and TX/ LA electricity prices are ~20% lower than the U.S. average. Thus, US Gulf Coast electricity costs are roughly 1/3 of EU electricity costs. In addition, Gulf Coast salt costs are also 1/3 of European costs.
Below are my estimates of regional input costs for chlor-alkali production. Note these are illustrative estimates which I believe are reasonable (but don’t consider specific plant economics such as self-generated electricity or government subsidies). The Middle East is cost competitive with the Gulf Coast for chlor-alkali production. The Chinese industry is split between ethylene and carbide processes. Carbide-based producers in China predominate in inland regions which have abundant coal. Given its highly pollutive nature (coal and mercury), the carbide process is not widely used outside of China. Thus, although China-carbide is cost competitive, the input cost estimates below don’t include offsetting negatives of higher pollution and logistics costs (+$50-100/ECU vs China-ethylene).
(3) Does the industry have a rational structure?
Because of its low-cost position and shipping distances, the US chlor-alkali industry is a net exporter and has very little exposure to imports. Unlike other commodities such as oil which can be easily shipped in large quantities, both Chlorine and Caustic soda do not travel well. Chlorine is a toxic gas which is very difficult to ship safely, so when it travels it usually does so in the form of EDC (a precursor to PVC). Caustic soda (as its name implies) is a corrosive agent, so when it’s shipped, it’s usually dissolved in water and put into special tanks. As a low-cost producer of chlor-alkali, the U.S. is a net exporter of both Caustic Soda (mostly to Brazil, Mexico and Canada) and EDC. US exports of EDC are shifting to Brazil due to the recent closure of large chlor-alkali plant with OLN being the beneficiary. China exports Caustic Soda and chlorine derivatives predominantly to Indian, Australian and Asian destinations. Exports from the Middle East go primarily to India, Australia and Africa.
The North American chlor-alkali market is very concentrated (I say North America because OLN and WLK have a plant each in Quebec). I estimate that OLN is the largest player with ~30% share, followed by Oxychem (OXY) at just over 20%, WLK at just under 20%, Shin Etsu (publicly traded in Japan) 10-15% and Formosa Plastics (publicly traded in Taiwan) 5-10%. Thus, the top 3 producers have ~70% of total industry capacity, and the top 5 producers have ~90%. Note that Oxychem was recently purchased by Berkshire Hathaway, so I believe they will remain rational (perhaps more so) going forward. WLK is acting disciplined, having announced capacity closures last month.
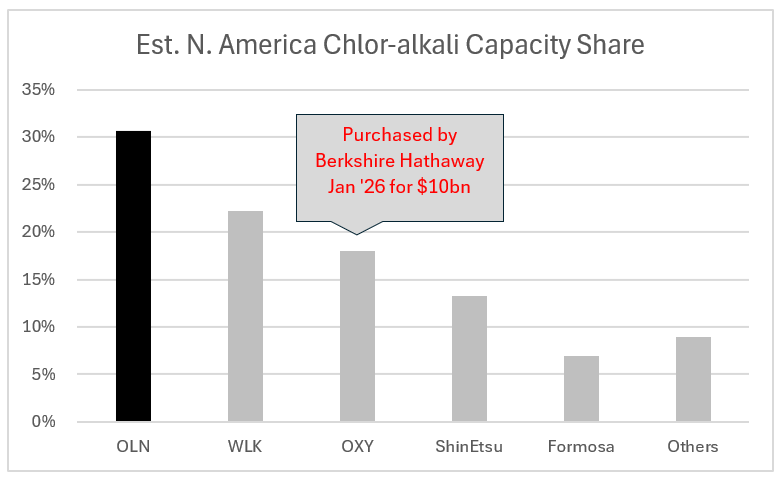
OLN is not only the largest chlor-alkali producer, but it is also the only one of the top 5 that isn’t vertically integrated into PVC production. Thus, I see OLN as the “swing capacity” in the industry (analogous to Saudi Arabia’s role in the oil market). As the swing producer, OLN has an important role in making the industry more disciplined. In late 2020, OLN started prioritizing “value over volume” which means they are willing to reduce their own capacity utilization in bad times to help maintain overall industry pricing levels. One can see this strategy shift materialize in OLN’s lower utilization rate vs the industry.
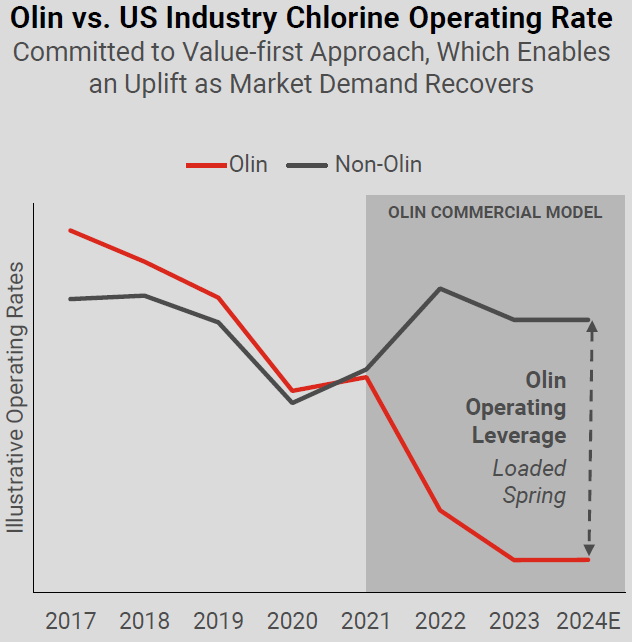
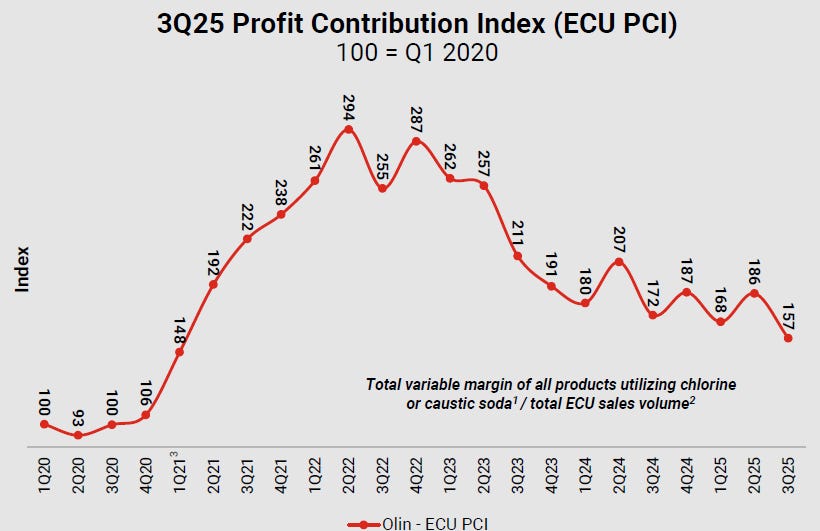
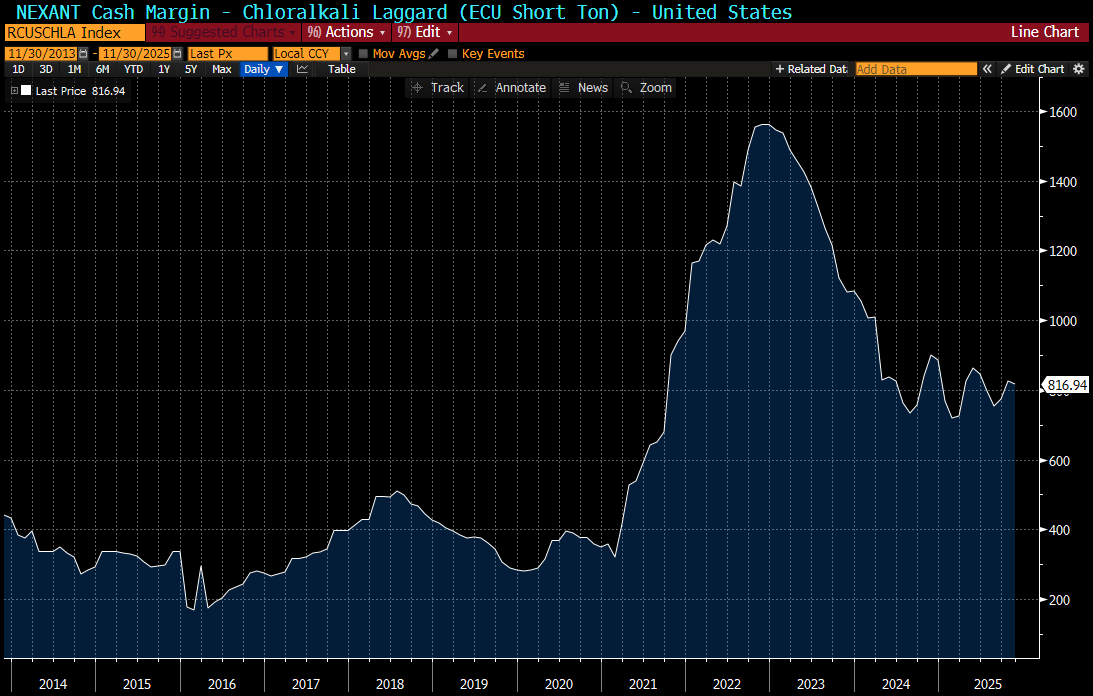
This is not a selfless move whereby OLN is sacrificing itself for the benefit of the industry, but rather this pricing strategy helps OLN itself make more money during downturns. The result: during this current trough, US chlor-alkali industry profits/ECU are well above prior trough levels.
In summary, the US chlor-alkali industry
is low-cost relative to the rest of the world (US ~1/2 the cost of EU)
is highly consolidated (top 3 are ~70% of industry and top 5 are ~90%)
is insulated from exports (hard to ship/store and the US is a low-cost producer)
is seeing rational behavior from its largest (~30%) producer who is curtailing its own production volumes during the downturn to support margins.
(4) Using reasonable estimates of normalized earnings power and fundamental value, does the stock have the potential to go up multiple fold?
My investing strategy for cyclical companies is to buy at trough levels and patiently wait for earnings to recover to normalized levels. As legendary investor Peter Lynch said, “The best time to get involved with cyclicals is when the economy is at its weakest, earnings are at their lowest, and public sentiment is at its bleakest.” As I’ll explain below, OLN’s current valuation looks high because current profits are depressed, but has a low valuation based on normalized profit levels.
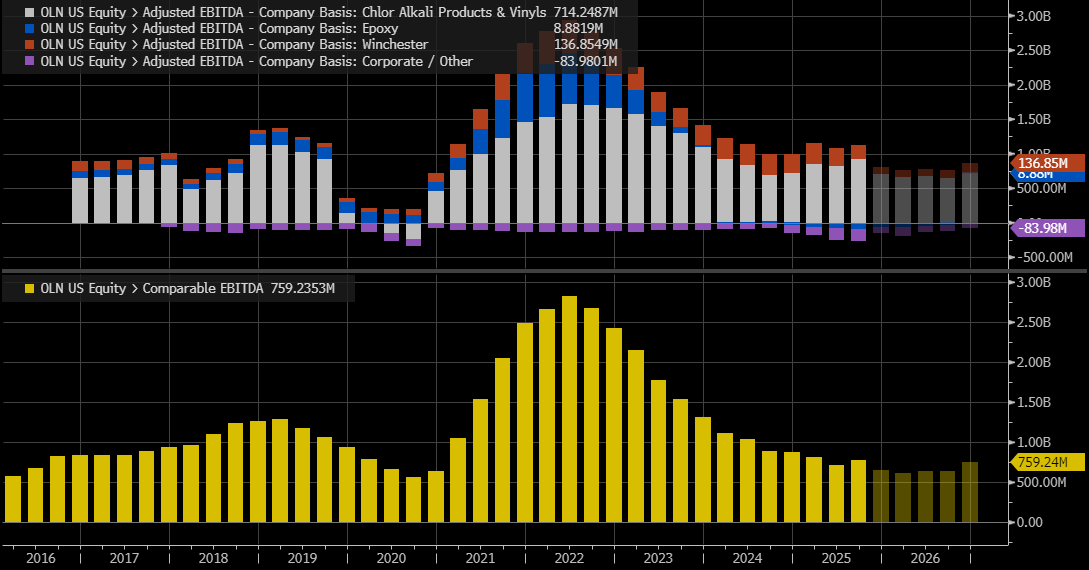
Below is a chart of OLN’s LTM (last twelve-month) EBITDA since 2016 (note OLN acquired Dow’s chlor-alkali business in Q4 2015). The top panel is EBITDA by segment, and the bottom panel is total EBITDA. The lowest LTM EBITDA was $563m in 2020 and the highest was $2.8bn in 2022. Based on OLN’s 1/8/26 pre-announcement, 2025 EBITDA should be ~$650m.
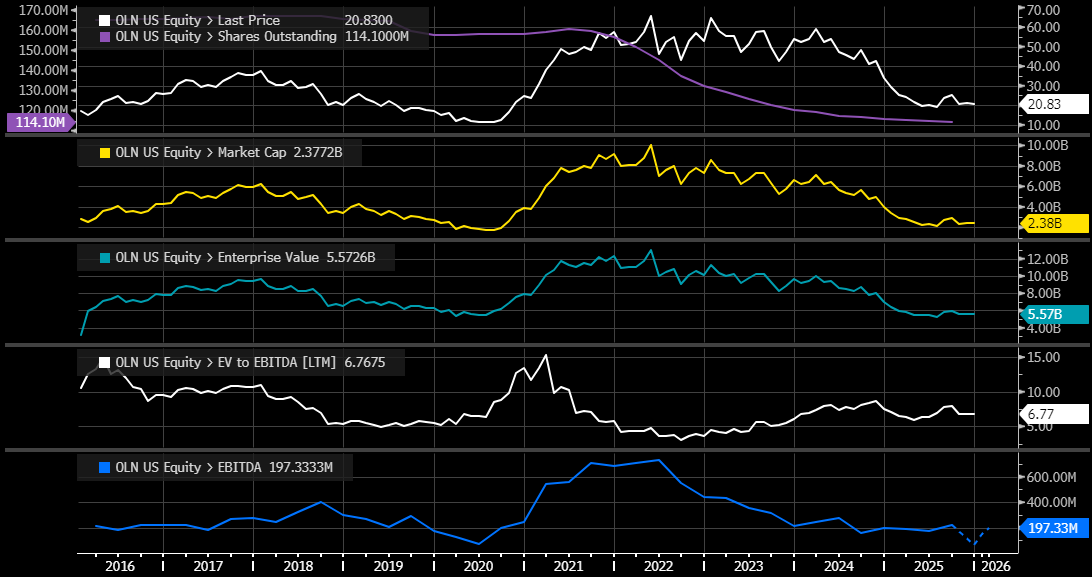
This next chart is busy, but worth explaining. The first panel shows price (white) and shares outstanding (which have fallen from 165m in 2018 to 114m currently). The Market Cap is simply the share price multiplied by the outstanding shares. Note the current Market Cap ($2.4n) is close to mid-2020 (Covid) lows because OLN has fewer shares (due to stock buybacks). The EV (enterprise value) is market cap plus debt minus cash. EV / EBITDA is the enterprise value divided by EBITDA. LTM EBITDA is the same as the total EBITDA in the chart above, shown in a line instead of bars.
What does this all mean for the potential share price going forward? Cyclical businesses are impossible to model with precision, so let’s look at some scenarios. The “OLN Target” scenario below is based on 2029 targets given at their December 2024 analyst day, and their detailed assumptions are in that presentation. A key driver of the $2.0bn EBITDA target is >$250m of structural cost savings, $70-90m of which were executed in 2025. I believe the OLN Target scenario may be optimistic on Epoxy, but their CAVP and Winchester targets are achievable. My more conservative “Base” scenario assumes lower realized cost savings and lower Epoxy earnings than OLN’s target. The Base scenario assumes CAVP gets to $1.2bn EBITDA (in between 2022 peak and 2025 trough); Winchester sees a rebound in Commercial plus continued growth in Military & Law Enforcement; and Epoxy achieves $50m of EBITDA (much lower than prior earnings levels).
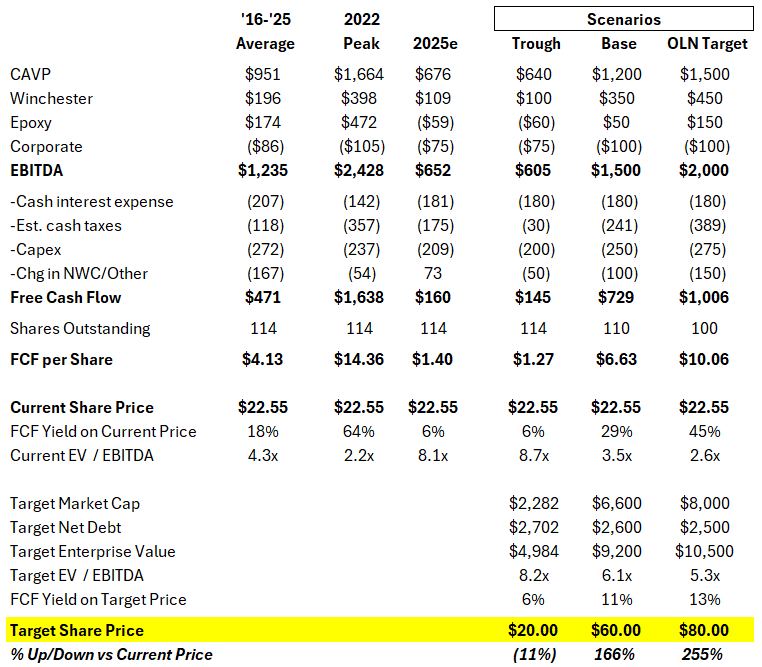
In the scenarios above, OLN can generate ~$6.50 of free cash flow (FCF) per share in the Base scenario and ~$10 of FCF/share in the OLN Target scenario. This equates to a 30-40% FCF yield on the current stock price. Given OLN’s current trough valuation, I believe that OLN’s stock presents a very attractive risk/reward with 15-20% downside and ~3x upside.
(5) Is the industry at or near trough levels with signs that we are bottoming?
As illustrated in the section above, I believe that all three of OLN’s segments are at trough earnings. More importantly, I believe all three segments are showing signs of bottoming/turning. For an industry such as chlor-alkali which operates large capital-intensive facilities, I believe the best bottoming indicator is capacity closures. Here are some notable closure announcements over the last year.
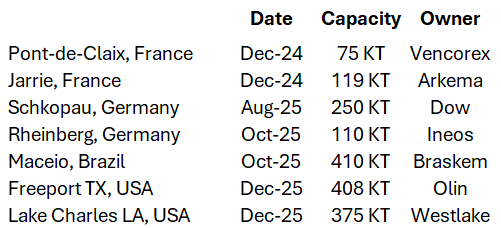
As detailed above, European chlor-alkali is not cost competitive, especially after the step-change higher in energy/electricity costs post the Ukraine invasion. I would not be surprised to see additional European capacity closures. I would also note that Europe is not a small production region from a global perspective – Europe and North America both have approximately 12,000 KT of total Chlorine capacity.
Of the three segments, I am least nervous about Winchester. I do not believe there has been a structural change in this business. Rather, there is too much channel inventory. What makes this inventory overhang hard to pin down is that the inventory is not just at the retailers, but also in consumer’s gun safes. Winchester’s Commercial sales boomed in 2021/2022 due to a surge in gun owners during 2020 (Covid lockdowns, civil unrest) followed by ammunition panic buying (new gun-owners, a contentious US election, and fears of shortages). However, Military & Law enforcement sales have been increasing, driven by a new U.S. Army contract and OLN could benefit from potential new Army contracts in 2026. I believe Commercial revenues are likely to start recovering in 2026, helped by OLN intentionally pulling back on production to right size inventory levels.
Epoxy is the most problematic segment as this has been severely impacted by Asian producers dumping low-cost epoxy into Europe and US. However, I believe the epoxy segment should get back to EBITDA positive in 2026 due to:
a $40m benefit from a new supply contract
recently enacted anti-dumping penalties from both the EU and the US.
(6) If the trough lasts longer than expected (which is usually the case):
- Does the company generate free cash flow at trough levels?
- Is the balance sheet strong enough to weather the storm?
Based on my scenario analysis (see Section 4 above), I think OLN can be free cash flow break even at ~$500m of EBITDA. OLN spends ~$95m per year on its dividend, so I believe OLN can continue to fund the current dividend at ~$565m of EBITDA. Note that during the pandemic-impacted year of 2020, OLN generated $600m of EBITDA (and maintained its dividend), and this was prior to their “value over volume” philosophy change.
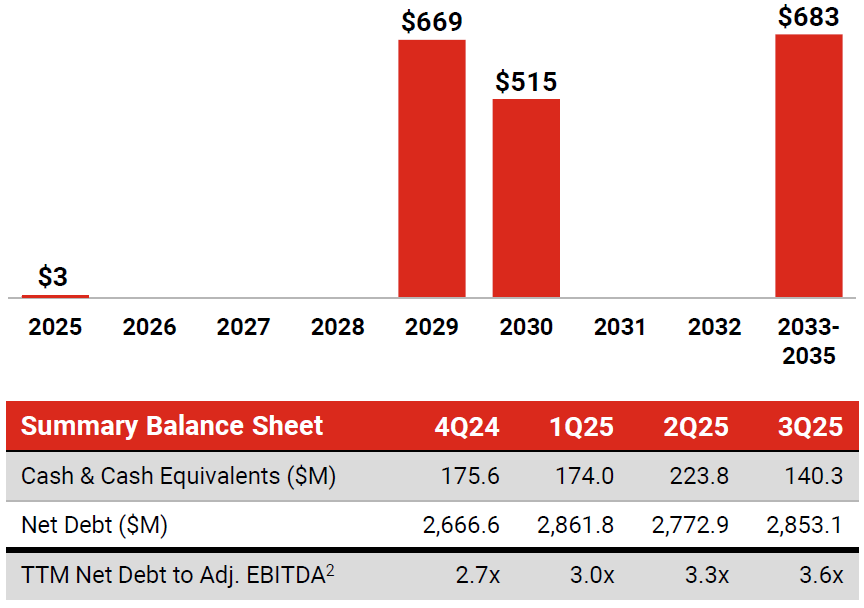
OLN has debt but its creditors are sanguine. There are no debt maturities until Aug 2029 and OLN’s longest tenor unsecured debt (Apr 2033) trades near par to yield ~6.6%. OLN does have a 4.0x leverage covenant on their credit agreement, but the language allows for generous EBITDA add-backs.
7) I don’t want to try to catch a falling knife – do the technicals look good?
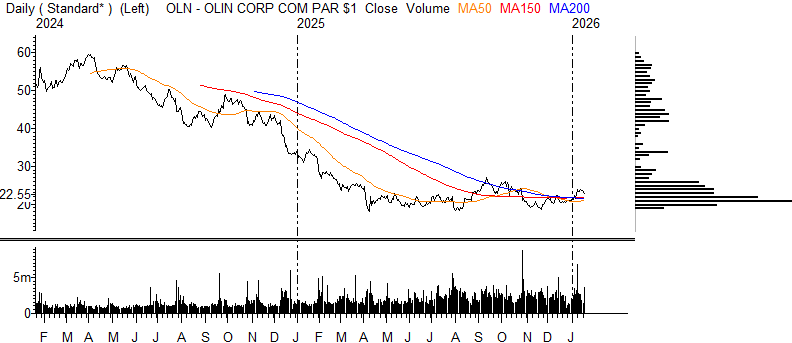
On the chart below first note OLN’s stock has been roughly cut in half since mid-2024 and it’s been bouncing around the bottom of the chart for almost a year. Next, look at the 50-day, 150-day and 200-day moving averages – all are flattening/ turning up, and the current stock price is above all three. The final thing to explain on this chart is the trading volume distribution bars on the right. A lot of volume has traded around current price levels but not much volume has traded above $25. In my opinion, this indicates OLN’s investor base has turned over into “strong hands” who own the stock around current levels. The lack of “overhead resistance” on trading volumes could mean there aren’t many sellers who are looking to “break even” until the stock hits ~$40.
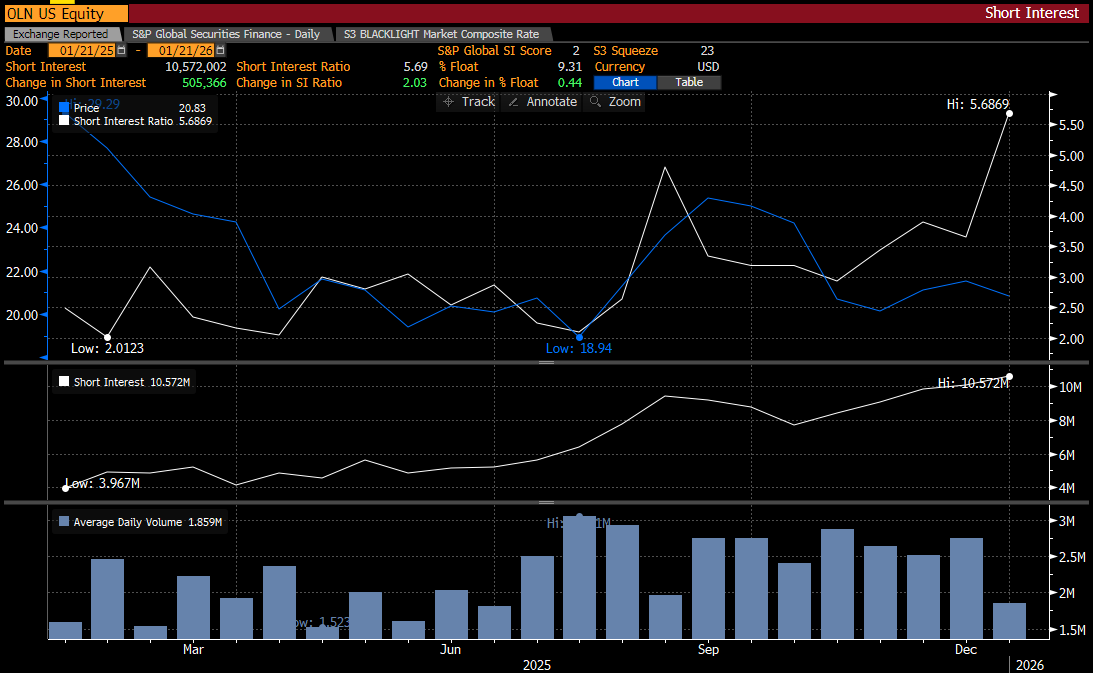
The next chart shows that the number of shares short has been increasing. There are currently 10.6m shares short (9% of the float). Given the research I have done, I don’t know exactly why investors are increasing their shorts on OLN, but I do know that there are 10.6m shares that could be bought if the stock starts to go higher.
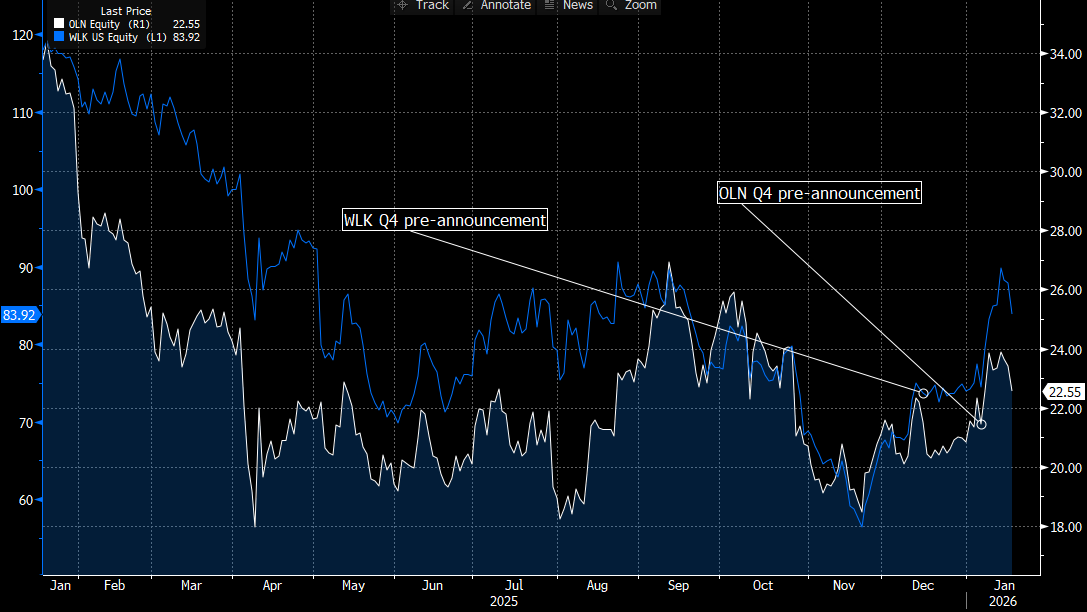
Stocks going up on bad news is often a sign of bottoming. It means investors are looking forward to what could be rather than how bad things have been. On 12/15/25 WLK announced capacity closures (good) but also pre-announced a very ugly Q4 EBITDA (bad). On 1/8/25 OLN announced a ~40% EBTDA miss vs the consensus estimate (bad). Seeing OLN stock rise after these announcements is bullish in my view.
Conclusion: Investing in cyclicals can be risky and frustrating. But I believe when the checklist can be checked, a high-quality cyclical stock like OLN can be a very attractive risk/reward opportunity. But one must be patient in waiting for the upturn.
Do your own diligence and let me know your thoughts.
Sources/Resources/Credits:
Bloomberg (it’s expensive but the charts sure are pretty)
OLN and competitor resources
Business Breakdowns
Substack articles


Convincing write-up. I owned some Olin a few months ago but sold due to too low conviction on my side, and to buy more gold miners. This post makes me want to switch some of the gold profits over to OLN and just sit on them for a few years or a few hundreds of per cent.
Nice analysis. Seems like something I should look into.